Status Center
| grandMA3 ユーザマニュアル » システム » Message および Status Center » Status Center | Version 2.5 |
ステータス・アイコンは、ソフトウェア内の動作や状態を示します。これらは、コマンドライン入力欄の横にあるコマンドライン右側に表示されます。
すべてのステータス設定は、ユーザプロファイルごとに設定されます。一部のステータスでは、すべてのユーザプロファイルに対応するステータスを表示するよう選択できます。
ステータス・アイコンをコマンドラインに表示するかどうかを選択するには、Message Center ウィンドウでステータスをスワイプします。
ドロップダウンに以下の選択肢が表示されます。
- Never: 機能が有効でも何も表示されません。
- On Activity: 設定や機能が有効な場合にアイコンを表示します。
- Always: アイコンは常にコマンドラインに表示されます。設定や機能が有効でない場合、アイコンはグレーアウトされます。
Status Center では、ステータスが有効な場合、そのアイコンとタイトルバーが対応する色で点灯します。
ほとんどのステータスには、さらに3つの Blink オプションがあります。
- None: ステータスが有効な場合でも、コマンドライン内のステータス背景は点滅しません。
- Once: ステータスが有効になると、その背景が一度だけ赤く点滅します。
- Always: ステータスが有効な間、その背景は赤く連続して点滅します。
一部のステータス(Highlight、Lowlight、Solo、Timecode Record)では、ドロップダウンでステータスの異なるソースを選択できます。
- My: 現在のユーザプロファイルによってトリガーされた場合、そのステータスは有効になります。ユーザプロファイルとして My が選択されている場合、ステータス・セルには
 が表示されます。
 - All: いずれかのユーザプロファイルによってトリガーされた場合、そのステータスは有効になります。ユーザプロファイルとして All が選択されている場合、ステータス・セルには
 が表示されます。

|
ヒント |
| ユーザプロファイルが All に設定されていて、Highlight、Lowlight、Solo、または Timecode Record が別のユーザプロファイルによってトリガーされると、アイコンの下に ext または my+ext が表示されます。機能が別のユーザプロファイルによってのみトリガーされている場合は ext が表示されます。現在のユーザプロファイルと別のユーザプロファイルの両方によって機能がトリガーされている場合は my+ext が表示されます。機能が現在有効なユーザプロファイルによってトリガーされている場合、アイコンの下にはテキストは表示されません。 |
Statuses
以下のステータスを使用できます。
Programmer:
- Highlight (
 ):
):
Highlight が有効です。アイコンをタップすると、Master Controls タブの一時的な Masters ウィンドウが開きます。 - Lowlight ():
Lowlight が有効な場合、アイコンは青になります。アイコンをタップすると、Master Controls タブの一時的な Masters ウィンドウが開きます。 - Solo (
 ):
):
Solo が有効です。アイコンをタップすると、Master Controls タブの一時的な Masters ウィンドウが開きます。 - Blind (
 ):
):
Blind が有効です。アイコンをタップすると、Master Controls タブの一時的な Masters ウィンドウが開きます。 - Preview (
 ):
):
Preview が有効な場合、アイコンはオレンジになります。 - Timecode Record (
 ):
):
タイムコードの記録 が有効です。アイコンをタップすると、Timecodes タブの Off Menu が開きます。 - Recipe Editing (
 ):
):
Edit Recipe モード が有効な場合、アイコンは緑になります。 - Grand Master (
 ):
):
Grand マスターがフルではありません。アイコンをタップすると、Master Controls タブの一時的な Masters ウィンドウが開きます。 - World Master ():
1つ以上の World Masters がフルではありません。該当する World Masters は、アイコン下の番号で示されます。100%以外の値に最後に設定されたマスターが最初に表示されます。アイコンをタップすると、World Masters タブの一時的な Masters ウィンドウが開きます。 - Group Masters ():
1つ以上の Group Masters がフルではありません。該当する Group Masters は、アイコン下の番号で示されます。番号は昇順に並びます。アイコンをタップすると、Group Masters タブの一時的な Masters ウィンドウが開きます。 - Grand Rate ():
Grand Rate マスターが 1:1 ではありません。アイコンをタップすると、Master Controls タブの一時的な Masters ウィンドウが開きます。 - Pause at End (
 ):
):
Recipe Editor で Pause at End がアクティブです。
Filter:
 ):
): ):
):Universe/Patch:
- Parked (
 ):
):
フィクスチャが パーク されている場合、アイコンは青になります。 - DMX Tester (
 ):
):
DMXテスター が出力を生成します。 - Not Enough Parameters (
 ):
):
パラメータ の上限を超えています。システムが過負荷状態で DMX出力のリフレッシュレートが低下している場合、アイコン下に Overload が表示されます。 - No Fixtures Patched (
 ):
):
現在のショーには、フィクスチャがパッチされていません。 - Patch Open (
 ):
):
Patch が開いています。別のステーションで開かれている場合、アイコン下に ext が表示されます。
More:
- World Server (
 ):
):
ステーションは ワールドサーバ に接続されています。 - Encoder Bar (
 ):
):
デフォルト以外のエンコーダバーが選択されています。 - Phasers:
コマンドラインのバーに、フェイザー の計算に割り当てられた現在の処理負荷をグラフィカルに示します。緑のインジケータは、アクティブに実行中のフェイザーを持つパラメータ数に応じて上昇します。正確な値は、コマンドラインの ツールチップ に表示されます。 - Flow Control:
コマンドラインの封筒アイコン( )の横にあるバーで、ネットワークの現在の負荷を緑のインジケータでグラフィカルに示します。フロー制御の正確な強度は、0~255のスケールでコマンドラインの ツールチップ に表示されます。フロー制御レベルは Network メニューにも表示されます。詳しくは セッション を参照してください。
Hardware:
- Battery (
 ):
):
デバイスの 電源状態 を表示します。full-size、light、full-size CRV、および light CRV 卓では、アイコンがデフォルトで表示されます。アイコンをタップすると、Battery Status ポップアップが開きます。バッテリーのないステーションでは、アイコンに取り消し線が表示されます ( )。
)。
デバイスがバッテリーで動作している場合、システムは現在のデバイスのバッテリー状態と、セッション内の他のデバイスのバッテリー状態を区別します。設定に応じて、影響を受けるデバイスを示す ext または my+ext がアイコン下に表示されます。別のデバイスが影響を受けている場合は ext、現在のデバイスと別のデバイスが影響を受けている場合は my+ext が表示されます。現在のデバイスが影響を受けている場合、アイコン下にテキストは表示されません。コマンドラインのツールチップと Message Center の Alert メッセージで詳細を確認できます。
バッテリーおよび電源状態については、UPSバッテリー を参照してください。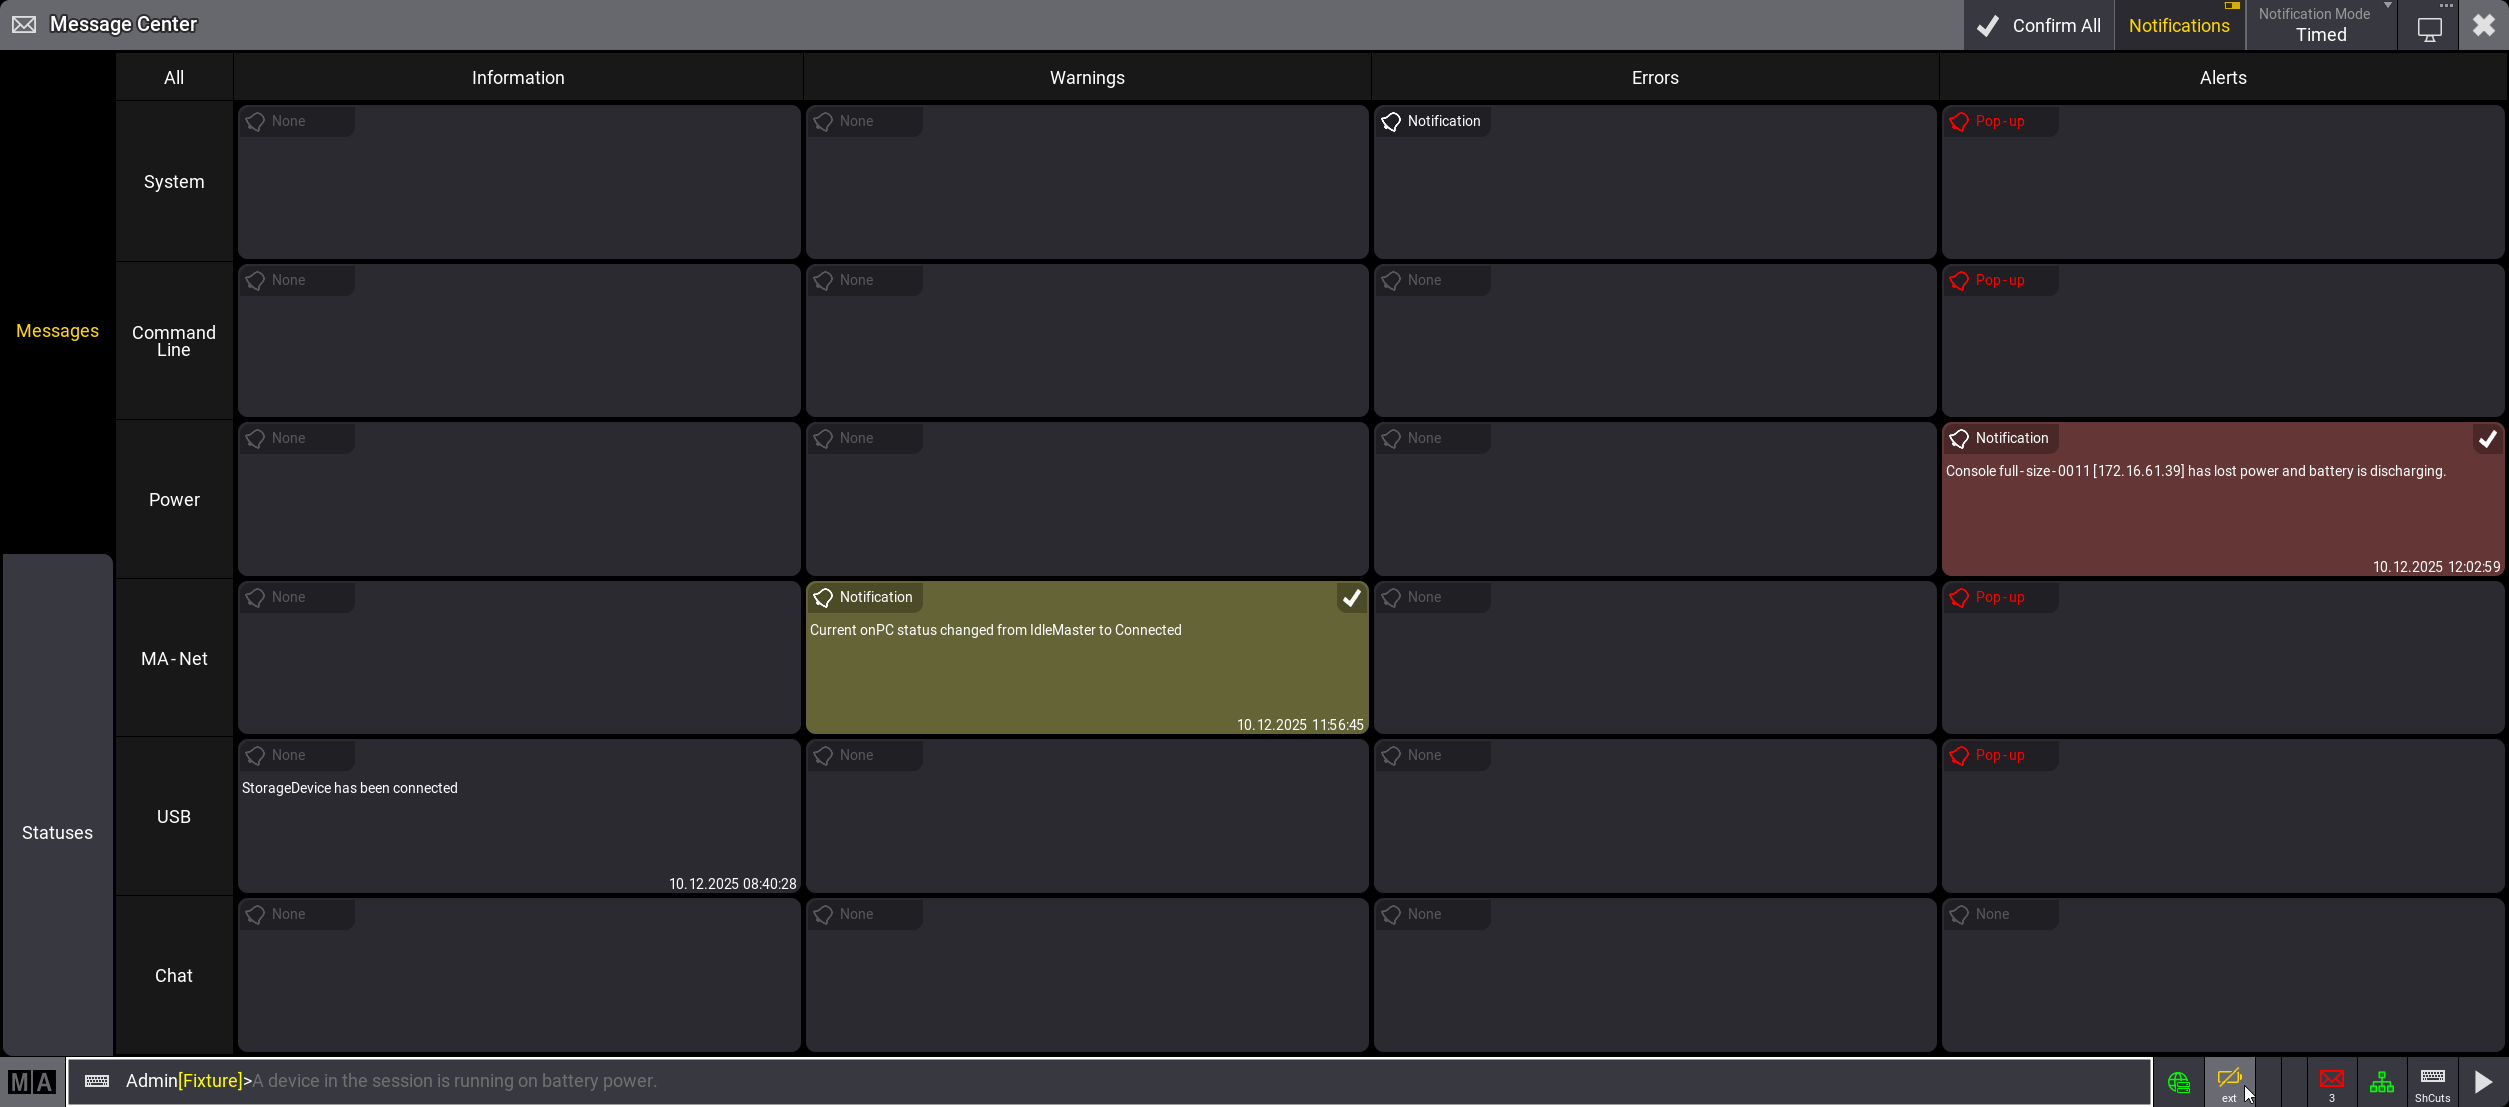
- USB Network (
 ):
):
USBネットワークが有効です。このステータスは onPC ソフトウェアでは使用できません。詳しくは USB Network を参照してください。 - ShowData (
 ):
):
ステータス・アイコン下に、メモリ使用量をMB単位で表示します。 - CPU (
 ):
):
ステータス・アイコン下に、CPU使用率をパーセンテージで表示します。 - Memory (
 ):
):
ステータス・アイコン下に、作業メモリ使用率をパーセンテージで表示します。 - CPU Temperature ():
ステータス・アイコン下に、CPU温度を°Cで表示します。 - GPU Temperature (
 ):
):
ステータス・アイコン下に、GPU温度を°Cで表示します。 - Fan Speed (
 ):
):
ステータス・アイコン下に、ファン速度をパーセンテージで表示します。 - Disk Space (
 ):
):
ステータス・アイコン下に、HDDの使用可能な空き容量をGB単位で表示します。
Toggles:
- Keyboard Shortcuts (
 ):
):
キーボード・ショートカット が有効な場合、アイコンは黄色になります。
Defaults
以下はステータスのデフォルト設定です。
Programmer
| Status | Display Mode |
Blink | User Profile |
|---|---|---|---|
| Highlight | On Activity | Always | All |
| Lowlight | On Activity | Always | All |
| Solo | On Activity | Always | All |
| Blind | On Activity | Always | - |
| Preview | On Activity | None | - |
| Timecode Record | On Activity | Always | All |
| Recipe Editing | On Activity | None | - |
| Grand Master | On Activity | Always | - |
| World Master | On Activity | Always | - |
| Group Masters | On Activity | Always | - |
| Grand Rate | On Activity | None | - |
| Pause at End | On Activity | Always | - |
Filter
| Status | Display Mode | Blink | User Profile |
|---|---|---|---|
| Filter | On Activity | None | - |
| World | On Activity | None | - |
Universe/Patch
| Status | Display Mode | Blink | User Profile |
|---|---|---|---|
| Parked | On Activity | None | - |
| DMX Tester | On Activity | Always | - |
| Not Enough Parameters | On Activity | None | - |
| No Fixtures Patched | On Activity | None | - |
| Patch Open | Never | Always | - |
More
| Status | Display Mode | Blink | User Profile |
|---|---|---|---|
| World Server | Always | - | - |
| Encoder Bar | On Activity | None | - |
| Phasers | Always | - | - |
| Flow Control | Always | - |
Hardware
| Status | Display Mode | Blink | User Profile |
|---|---|---|---|
| Battery | On Activity | - | - |
| USB Network | On Activity | Always | - |
| ShowData | On Activity | None | - |
| CPU | On Activity | - | - |
| Memory | Never | - | - |
| CPU Temperature | Never | - | - |
| GPU Temperature | Never | - | - |
| Fan Speed | Never | - | - |
| Disk Space | Never | None | - |
Toggles
| Status | Display Mode | Blink | User Profile |
|---|---|---|---|
| Keyboard Shortcuts | Always | None | - |